EVERYTHING YOU ALWAYS WANTED TO KNOW ABOUT STACKING CONVEYORS
(But were afraid to ask)
We aim to provide a better understanding of the dynamics of production systems consisting of equipments separated by single line stacking conveyors. Understanding the full implication of the density, the sensor position, the timeout duration, the stacking point, and getting to know how to calculate them is of major importance in all industrial simulation models using staking conveyors.
INTRODUCTION
Packing lines are the last step in a production process. They are in most cases the “poor cousin” of the plant, not much considered by engineers more keen on focusing on processes that create the product. Some say: “What interest could there be in putting a product already made into bottles, tubes or flasks? Only the content matters.” We think the exact opposite: there are major challenges and skillful issues on everything related to packaging, starting with conveyors.
We’d like to provide a better understanding of the dynamics of production systems consisting of steps separated by single line stacking conveyors. We are considering high speed production system (several hundreds of units per minute) for which using single items to simulate each individual product would be very inefficient in terms of computing time. This is the case for most packing lines in the food, beverage or healthcare industry. But the same principles could easily be applied to other processes that are not packing, provided that they consist in production steps in line separated by single line stacking conveyors.
We will study the simple case of two machines in line separated by a stacking conveyor. Most packing lines are much more complex and have more than two machines. But we do think that the precise understanding of a simple system dynamics is crucial for those who want to correctly simulate and efficiently setup complex lines.
Terminology
Upstream & Downstream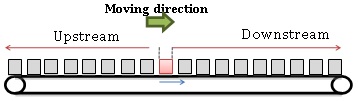
Upstream is the part of the line from where products are coming (bottles, flasks). Downstream is the other part.
Stacking conveyor
Stacking conveyors have two main functions: conveying objects from one machine to the next AND accumulating them just before the downstream machine. There can be different types of stacking conveyors. We are here considering conveyors on which bottles are moving in single file. If the downstream machine is off or goes slower than upstream, the conveyor still moves at its own speed and bottles can stack upstream the downstream machine.
Density on the conveyor
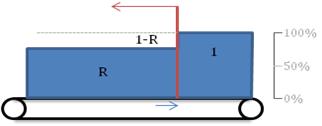
It may seem weird to talk about density on a conveyor that contains separate items. But if you step back from the conveyor and consider the conveyor as a succession of lengths more or less filled, density does make some sense. The following figures illustrate this point.
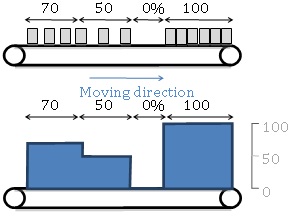 The second representation (with the blue curve) is the one we will use the most, and you’ll see that it is very convenient – also saving a lot of time because you do not need to draw each bottle. The percentage corresponds to the percentage of space occupied by bottles. In fact, density is this percentage multiplied by the maximum number of bottles a length unit can hold (we are talking about number of bottles per linear meter on the conveyor). If we think about each single bottle on the conveyor we could be tempted to say that the conveyor is just a succession of zones filled at 100% (there is a bottle here) or at 0% (there’s nothing here). If you have small bottles compared to the conveyor's length and high production rates, the density approach is both efficient and accurate.
Stacking point
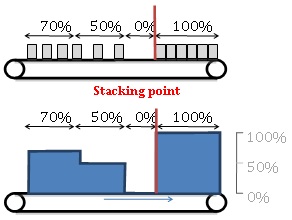 When downstream machine is off or if it simply absorbs bottles slower than the conveyor feeds it, the bottles are stacking, touching each other on a single line. This is what we call stacking. Last bottle stacked on the conveyor is what we call the accumulation or stacking point. Between this bottle and the downstream end of the conveyor, density is equal to 1/D where D is the diameter of the bottle.
We also talk about a filling level of 100%. It is now interesting to understand that this point can move very fast on the conveyor. Even much faster than the conveyor speed itself. Example: In the following situation the conveyor works 1.5 faster than upstream and downstream machines.
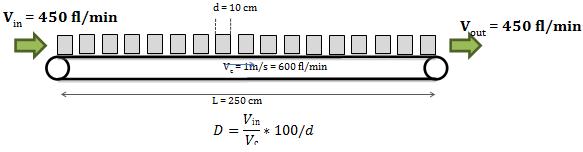
D = density (bottles per meter).
Vin = upstream bottles speed per minute
Vc = conveyor speed
d = bottle diameter (or space it occupies on the conveyor).
To simplify notations, we consider that when bottles are touching each other we have a filling (R) of 100% (It is easier to talk about a filling percentage than about a density per meter).

In our case R = 75%
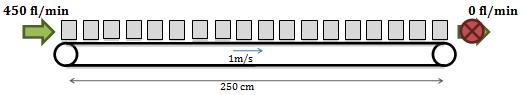
Some breakdown downstream will cause bottles to stack. After a ½ second breakdown the stacking point is already at x = 150 cm

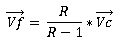
Stacking point moves from right to left at a speed of 3 m/s, 3 times the speed of the conveyor itself! If the downstream flow is completely stopped, the speed of the stacking point is:
R is the density just upstream the stacking point.
Note: We are talking about absolute values for Vf and Vc. We could also write:
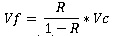
Graphical f with densities allows you to better understand this formula.
To get a progression of stacking point you need to “fill” 1-R part with bottles. They are brought by conveyor with a rate of R * Vc. As you fill « 1-R » (empty space to be filled) stacking point speed is R * Vc / (1-R)
Knowing the stacking point position on a conveyor is, as we will see, very important for the packing line’s behavior.
Obstruction sensor (or optical cell)
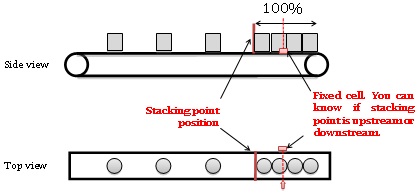
But conveyors seldom tell you continuously the position of the stacking point (they should!). To have an idea of the stacking point position on the conveyor, we generally use obstruction cells or sensors.
Sensor’s timeout
On the previous drawing it is easy to understand that a non-stacked passing bottle should not be mistaken for a stacking point position indication. To avoid a short reaction of the sensor each time a bottle is passing (we want to know the stacking point position, we are not counting bottles) there is a timeout linked to the sensor. Sensor reacts only when obstruction is longer than a given duration. This means that the sensor gives its information with a slight delay (we’ll see that this delay can be adjusted and intentionally long).
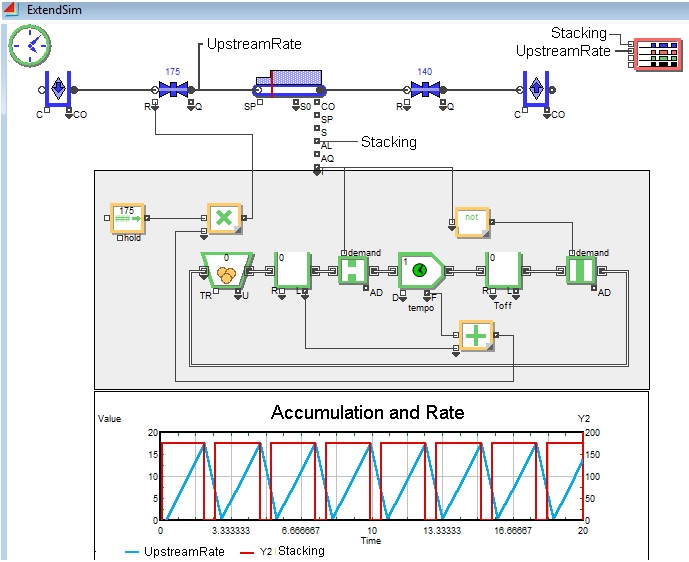
Application case
A standard packing line normally consists of a succession of many equipments linked by conveyors. We have chosen here a very simple particular case with one upstream machine, one conveyor and one downstream machine. This very simple example will still be enough to illustrate important principles.
Two machines + one conveyor + different speeds
Its is frequent to think that conveyors' stacking capability is only here to protect machines from a failure of the other machines. Surprisingly people accept the idea of frequent breakdowns but consider obvious that a machine should be set up at the same nominal speed all along the packing line.
In fact, even on an appropriately-sized line, equipments have different speeds, for process or quality reasons. As a consequence of this, you will see conveyors being filled, upstream machines stopped, then conveyors unfilled, at unpredictable frequencies. Some talk about a sort of wave on the conveyor. We will see how intelligent positioning of sensors and setting of timeouts can minimize these stops and starts.
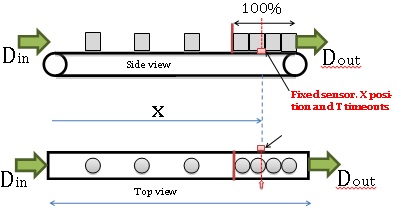
Our case:
Upstream has a rate of Din. Downstream has a rate of Dout.
Stacking conveyor a length L and a speed V.
Upstream is stopped when sensor (x position) is hidden for more than T seconds (Timeout).
Upstream starts again when sensor is unhidden (stacking point down to x again).
Sensor position: What value (in meters from the conveyor entrance) should we set for x?
Timeout: What value should we set for T (seconds)?
What can happen if x and T are not well set up?
What can we optimize in this system playing only with x and T?
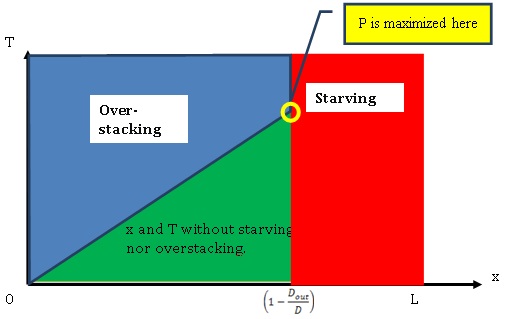
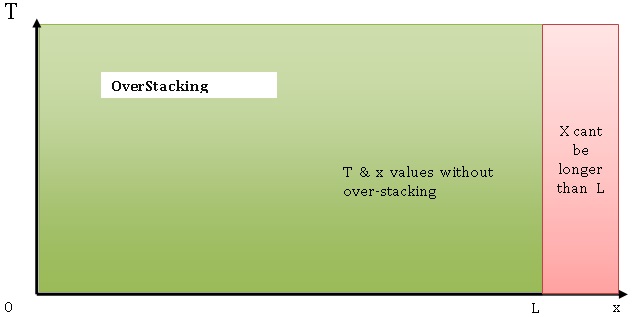
Playing with x and T we have 3 aims:
- Avoiding bottles from stacking up to upstream machine before it stops (it could damage the machine). We call this situation “Overstacking“.
- Avoiding downstream machine to be stopped because of a lack of bottles. We call this “Starving“.
- Minimizing upstream machine stop and start frequency. This also is equivalent to maximizing length of running periods for upstream machine.
Generic case
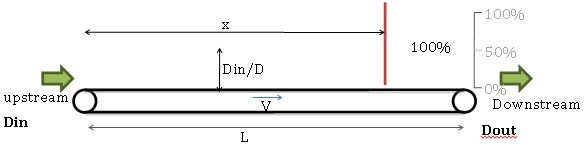
D is the conveyor’s rate (D=V/l).
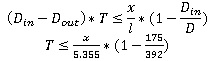
Situation at the start of stacking: stacking point just covered sensor at x. Of course, this only happens if Din > Dout (we implicitly chose it to be like this in this case). Upstream will be stopped in T seconds (timeout). We don’t have an overstacking if conveyor is not full before T seconds. This can be expressed with the following equation:
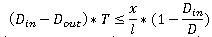
The further from upstream machine the sensor is, the shorter is the timeout and the less risk of over-stacking we have.
What happens?
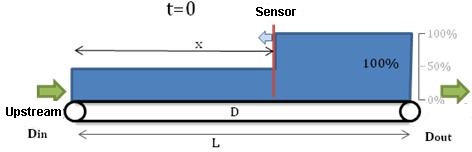
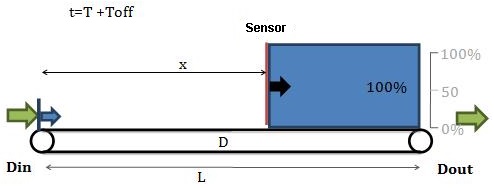
t=0, timeout starts, upstream machine will be stopped in T seconds. Stacking is still ongoing (stacking point is moving upstream).
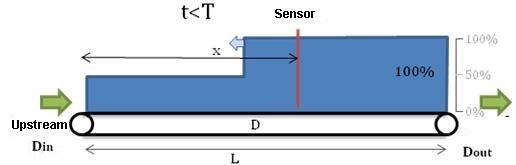
t<T, upstream machine is still on, stacking point is still moving upstream.
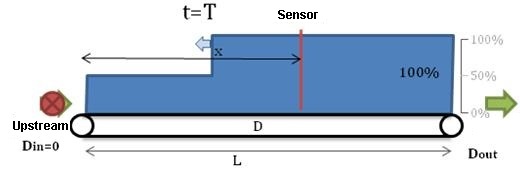
t=T upstream machine is stopped. But stacking is still ongoing on the space upstream the stacking point.
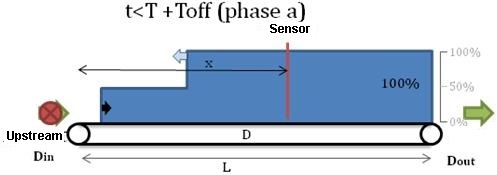
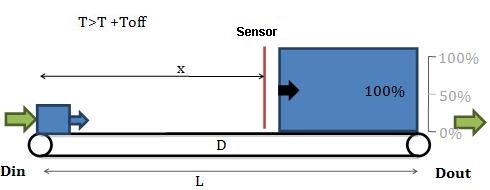
t<T+Toff during a first phase we will call phase a, the stacking point is moving upstream while the last bottle moves downstream.
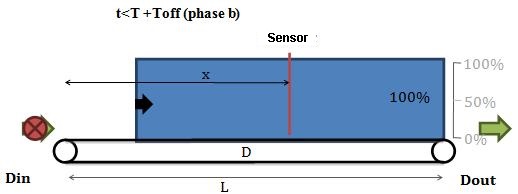
t<T+Toff during the following phase (phase b), the stacking point moves back downstream.
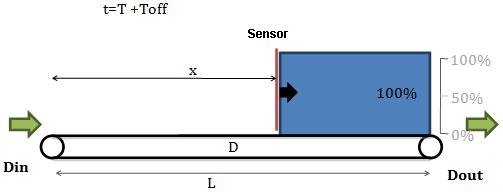
t=T+Toff The sensor becomes uncovered, and the upstream machine can be restarted. Toff is the duration during which the upstream machine was stopped.
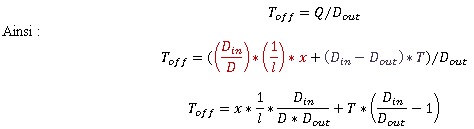
How can we calculate Toff?
The situation at t=T is the following:
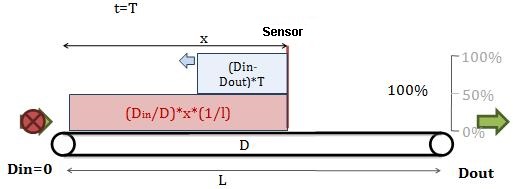
When the upstream machine is stopped, it is mandatory to "pull" all bottles upstream the sensor, so that the sensor is uncovered again. The quantity to pull is given by the following formula:
The time for these bottles to be all pulled depends on the machine and is given by the following formula:
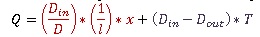
The time for these bottles to be all pulled depends on the machine and is given by the following formula:
T increases with x
Toff increases with T
Activity period of the upstream machine:
Toff = off duration of upstream machine
Ton = on duration of upstream machine
P = Toff + Ton : Activity period of the upstream machine.
Restarting the upstream machine
See what happens after the upstream machine is put back to work.
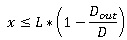
If you don’t want the downstream machine to be starved, the first bottle exiting the upstream machine must have the time to be conveyed to the end of the conveyor before the downstream machine pulls all the accumulated bottles. It gives the following equation:
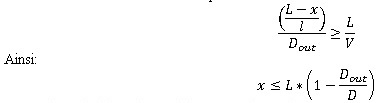
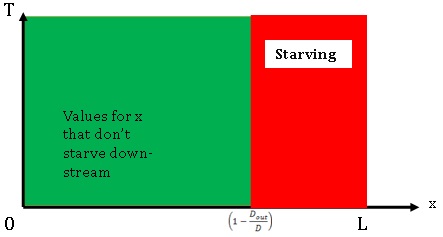
To avoid starving the downstream machine, x must not be too big. Put differently, the sensor must not be too far from the upstream machine.
If you don’t starve the downstream machine, it will operate at a rate of Dout.
Thus 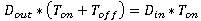 tells us that what is produced by the upstream machine is taken by the downstream machine.
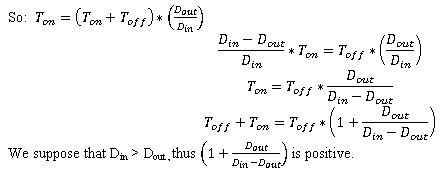
Thus Toff+Ton increases when Toff increases. Toff+Ton is precisely P, the activity period of the upstream machine. We have seen before that Toff increases when x increases, and that Toff also increases when T increases. Thus:
- P increases when x increases
- P increases when T increases
Put differently, the bigger x and T, the bigger the period.