Google Earth is fascinating – we have all been playing with, to look at favorite spots (my neighborhood!), or famous places… or deserted ones. How could we not wish to find such realism and flexibility in the animation of a model related to geographical issues?
We had the opportunity to apply the technique – it is possible to use a discrete event simulation model to generate a standalone file that can be read using Google Earth to show output and animation of simulation model. Let's see.
Introduction
Industrial simulation models are often associated with logistical issues involving large scale systems. It can be a multi-sites logistic chain with suppliers, consumers, inventories and transporters across a whole country. It can be boats or planes all around earth, subway systems in a city or logistic war operation in a desert.
In these models, most of the time animation is nothing more than moving objects on a map that had been pasted on the background. Depending on the simulation package, on the programmer skills (and global budget!), this animation will be somewhere between ugly and fanciful.
The models we develop are clever, sophisticated, they require hundreds of hours understanding and reproducing precisely what was needed in the real system. There is science in it, state-of-the-art calculation algorithms, optimization, lots of scenarios analyses… and we offer it with very basic animation. Some may think that animation is not the heart of the project, and that the real matters are results and model accuracy. But animation is also what gives a simulation model communication power, demonstrative force and immediate understanding.
Technical principles
To represent ExtendSim model results on a map, one needs to use a dynamic 2D / 3D map editor, allowing for interpretation and display of results.
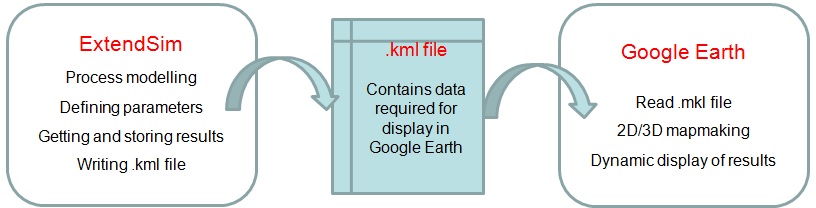
For each relevant move, the model writes in a datable the description of this move. Then is written the .kml file containing information that Google Earth will be able to read (mostly tags and coordinates). For this purpose we coded a set of functions in dlls that can be called using the ExtendSim ModL language.
Advantages/Disadvantages
Advantages
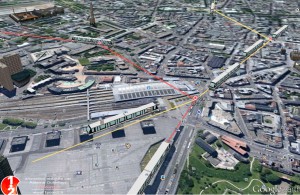
- It is really an amazing interface – the user may zoom in and out, change point of view, etc. while animation is running.
- It is more than just a great animation, because it allows for a huge variety of ways to present geo-localized outputs and results.
- The KMZ format (i.e. compressed KML) is a standalone format. The animation file can be given to customer without giving the model itself.
- Everything in terms of user interface has been developed in and well integrated to Google Earth, which is widely used and available for free.
- Online documentation and tutorials are available and easy to understand.
Disadvantages
- It is a post simulation animation – simulation is over, you play the film of the animation.
- You still need to understand .kml format.
- Your simulation software must learn how to generate kmz files. Achieving this with ExtendSim was not difficult, but time consuming.
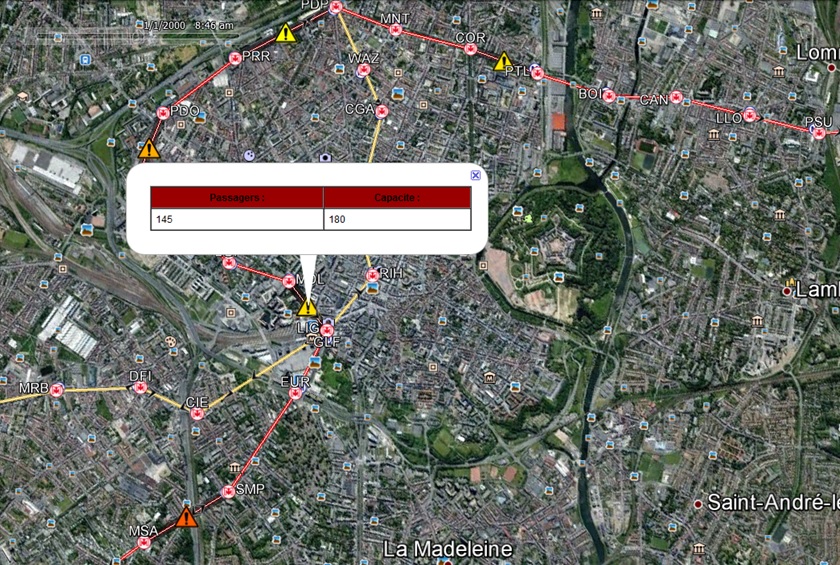
Application case
We built a model for the company that operates the suwbay of the city of Lille, with the aim of anticipating the increase of attendance in public transports and optimizing both the timetables and the number of vehicles. We could apply the technique on other models since.