In industrial simulation models, it is possible to get information about anywhere and at any time. There is almost too much data available, with the temptation to follow many indicators, relevant or not, paying it with a loss in execution speed, as most indicators change with time. We attempt here to give a piece of advice – and of course what we say cannot apply to all models!
Basics
In standard industrial simulation models, we will often watch:
- stock levels (min/max/average) and storage time in stock for targeted products.
- material balance for targeted products, taking into account the consumed, rejected, combined, discarded etc. (this will be used for debugging as well, to be sure the model did not create or absorbed material).
- throughput rate (min/max/average) of a machine (or even a full production line).
- tracking of failures and various stops.
- waiting time.
- possible cost calculations.
- for vehicles, the number of kilometers covered laden and unladen.
Stars
The OEE or Overall Equipment Effectiveness is an indicator that may convey precious information, if everybody agrees about what it takes into account in the model during its calculation. It is not forbidden to create one's own "custom" OEE by slicing the total time attached to an equipment into several categories, provided the sum of categories fills the total simulation time and no overlaping exists between categories. See also the page Enhancing effectiveness using simulation.
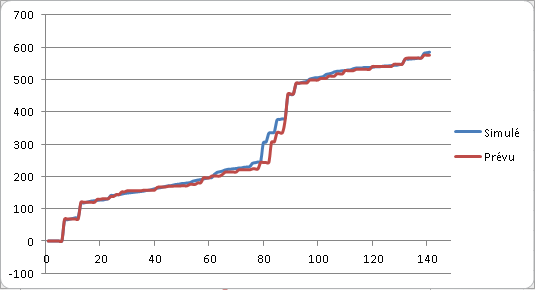
Schedule Adherance is the variance between actual production and scheduled production. Or in other words, the percentage of orders served at the scheduled date (one will watch carefully differences, before or after schedule). In a simulation model you will often see two lines plotted in a same window, so as to see at once if the actual line fits the expected line – before analyzing in detail the differences and their factors.
For shared resoures (AGV, multi-skilled operators, forklifts etc.), one should follow demands' waiting time before being served, which helps detecting where and how much enhancements can be made.
Some favorites
Tracking tables for various products: storing from creation to delivery the dates for each step and the route they followed. This indicator, very adapted for operation analysis, is evidently easier to use when a database-like structure is combined with the model.
When you study several operators (or other shared resources), watching the loading rate is a way to see if the load is fair between operators – irrespective whether or not resources fit the demand.
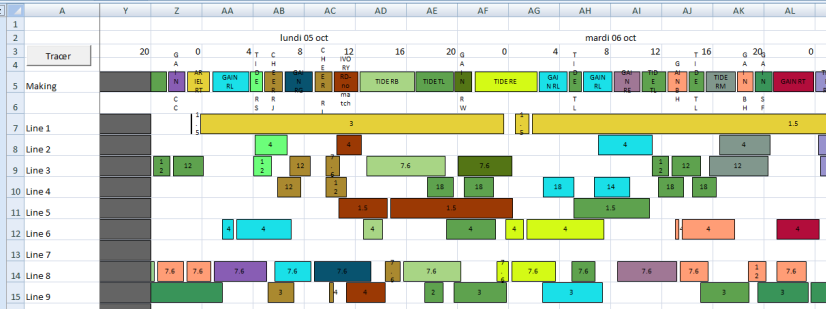
A Gantt diagram is much more than seing the "movie" of what happened during simulation for an equipment or a manufacturing line. In this respect it is much more relevant than looking at model animation, that gives an instantaneous vision of things. It is also a merciless revealer for debugging, putting into light operational inconsistencies that that could be left aside.
And by the way, don't forget to also look at the execution time of the model!…